![]()
Process Analysis: Process Mapping
When you think about supply chain management, you might picture trucks moving goods, warehouses filled with inventory, or production lines running at full speed. But have you ever stopped to ask: Are these processes working as efficiently as possible? Or, How do we find and fix bottlenecks, reduce waste, and improve flow?
This is where process analysis comes in. In supply chain management, process analysis is the systematic study of each step—from raw material sourcing to final product delivery—to understand how work gets done and where it can be improved.
The process involves key elements like mapping, calculating capacity, and rebalancing workflows. Mapping is often the first step because it gives a clear visual of how activities connect and where changes can have the most impact.
Example: A Wooden Chair Factory
In Darden Business Article: Operations Management – An Introduction to Process Analysis there is a Hawaiian shirts example demonstrating core concepts in process analysis.
Here, I am going to use a similar example. Imagine a wooden chair factory, where a different worker handles each task. The production process has five steps, with one worker assigned to each of Steps 1 through 4, and two workers assigned to Step 5.
- Step 1 – Cutting: A worker cuts wood into parts for the chair: legs, seat, backrest, and supports.
- Step 2 – Build 1 (Base Assembly): Another worker uses an assembly workstation to attach the legs to the seat, forming the base.
- Step 3 – Build 2 (Final Assembly): At the same type of assembly workstation as Step 2—but using an additional workstation to handle higher demand—a worker adds the backrest and armrests.
- Step 4 – Sanding and Painting: A worker smooths all surfaces, then paints or stains the chair.
- Step 5 – Packing and Shipping: Workers package, label, and prepare the finished chair for delivery.
Assume that between each step in the process, there are 5 units of inventory waiting as a buffer for the next step.
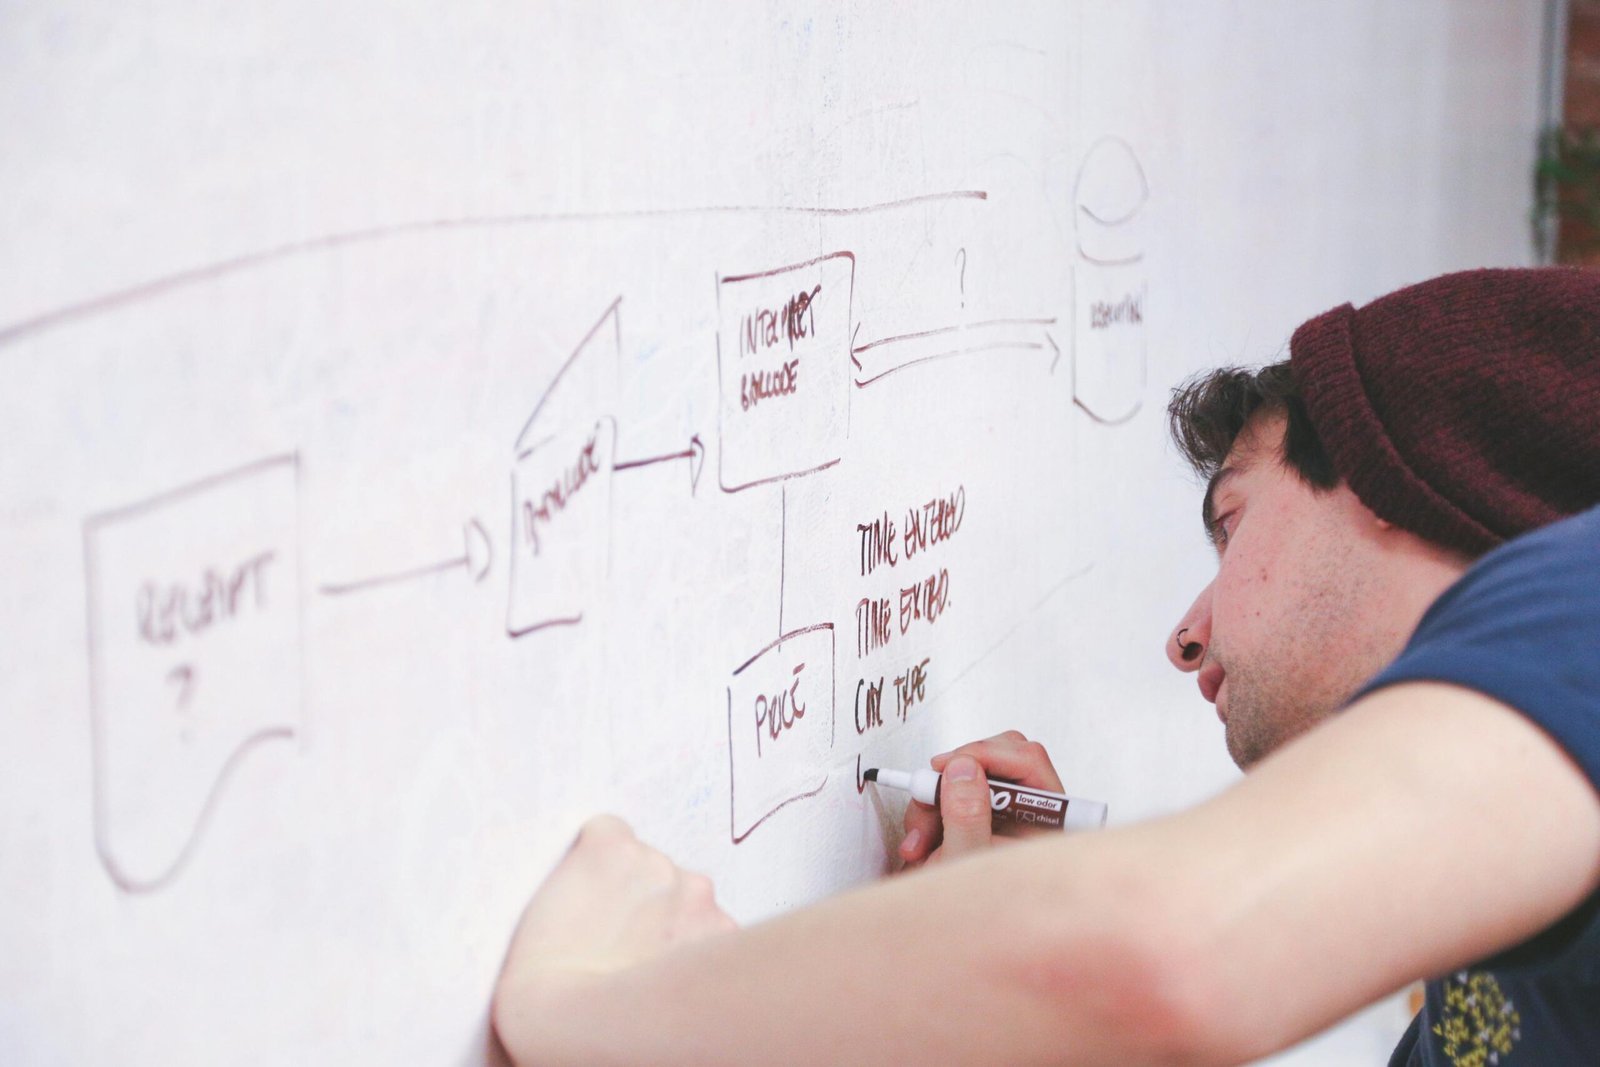
Mapping the Process
To visualize this process, we can create a process flowchart using three simple symbols:
- Square: A Step or Resource (e.g., a workstation or machine)
- Arrow: Transit (the movement of items between steps)
- Triangle: Storage (inventory or a buffer before the next step)
By combining these symbols, we can create a clear, visual representation of the entire factory floor and its workflows. This makes it easy to spot where delays or bottlenecks might be occurring.
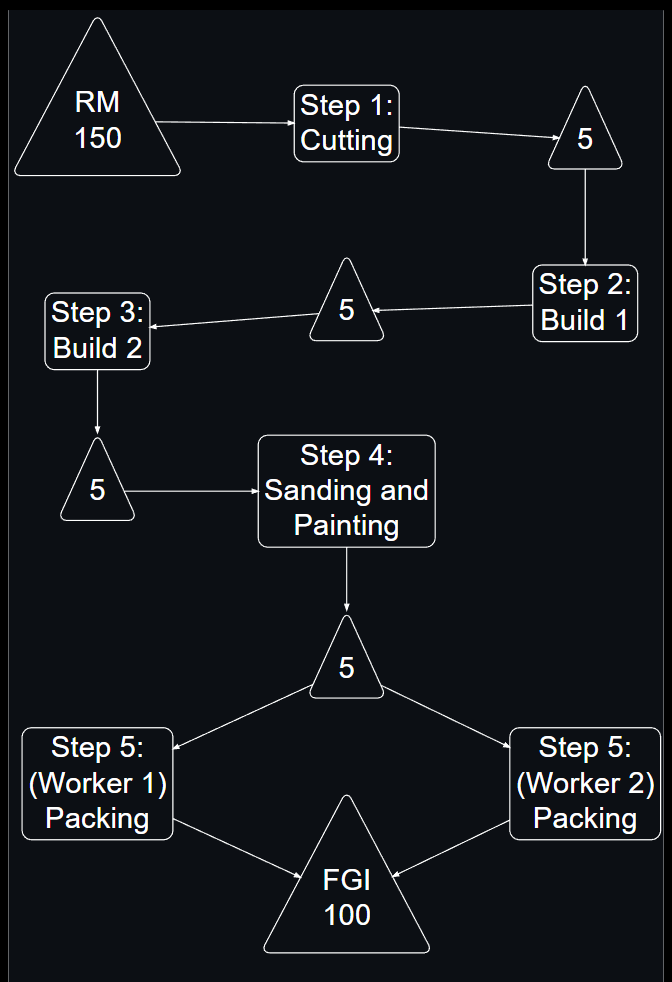
Inventory Terms
The flowchart also helps us visualize different types of inventory, which are key to understanding the process flow:
- Raw Materials: Items that have not yet entered production (e.g., wooden planks, paint, packaging materials). In our example, the raw materials are at the very beginning of the process.
- Work in Process (WIP): Items currently being worked on or waiting between steps, often serving as buffers. The triangles with the number “5” in our flowchart represent this WIP buffer.
- Finished Goods Inventory (FGI): Completed products ready for shipping to customers. This is the final triangle in our flowchart, representing the finished chairs waiting to be shipped.
In the next post, we’ll look at what capacity is and how to calculate the capacity for each step and