![]()
The Cash Conversion Cycle: A Real-World Case Study
Following our previous exploration of the cash conversion cycle (CCC), we will now put the theory into practice. This analysis will focus on calculating and examining the CCC for Amazon, a company well-known for its exceptional cash management efficiency. By understanding how Amazon manages its working capital, we can gain valuable insights into the components of a highly optimized CCC.
To begin, we will need to obtain Amazon’s financial statements. The most reliable source for this information is the Securities and Exchange Commission (SEC), which provides highly reliable data for all public companies through its EDGAR database. The specific method for retrieving these financial statements from the SEC’s website was detailed in a separate blog post linked at the bottom of this article.
As we explored in the previous post, the formula for the cash conversion cycle (CCC) is as follows:
$$ \text{CCC} = \text{DIO} + \text{DSO} – \text{DPO} $$
Where:
- DIO: Days Inventory Outstanding, which measures the average number of days it takes for a company to sell its inventory.
- DSO: Days Sales Outstanding, which measures the average number of days it takes a company to collect payment from its customers.
- DPO: Days Payables Outstanding, which measures the average number of days a company takes to pay its suppliers.
1. Calculating Days Inventory Outstanding (DIO)
So let’s start with calculating the Days Inventory Outstanding (DIO). The DIO is calculated by dividing 365 days by the company’s inventory turnover. Inventory turnover’s formula is as follows:
$$ \text{Inventory Turnover} = \frac{\text{Cost of Goods Sold}}{\text{Average Inventory}} $$
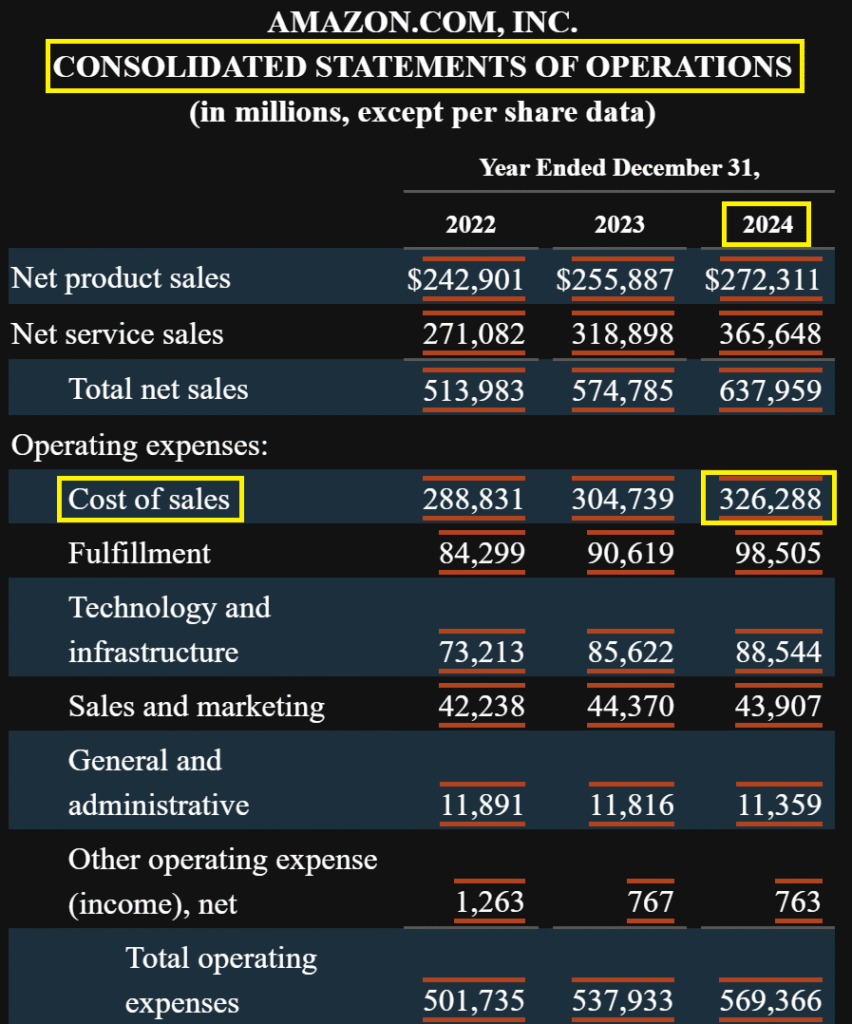
The Cost of Goods Sold (COGS) for 2024 is $326,288 million, as shown in the “Consolidated Statements of Operations.”
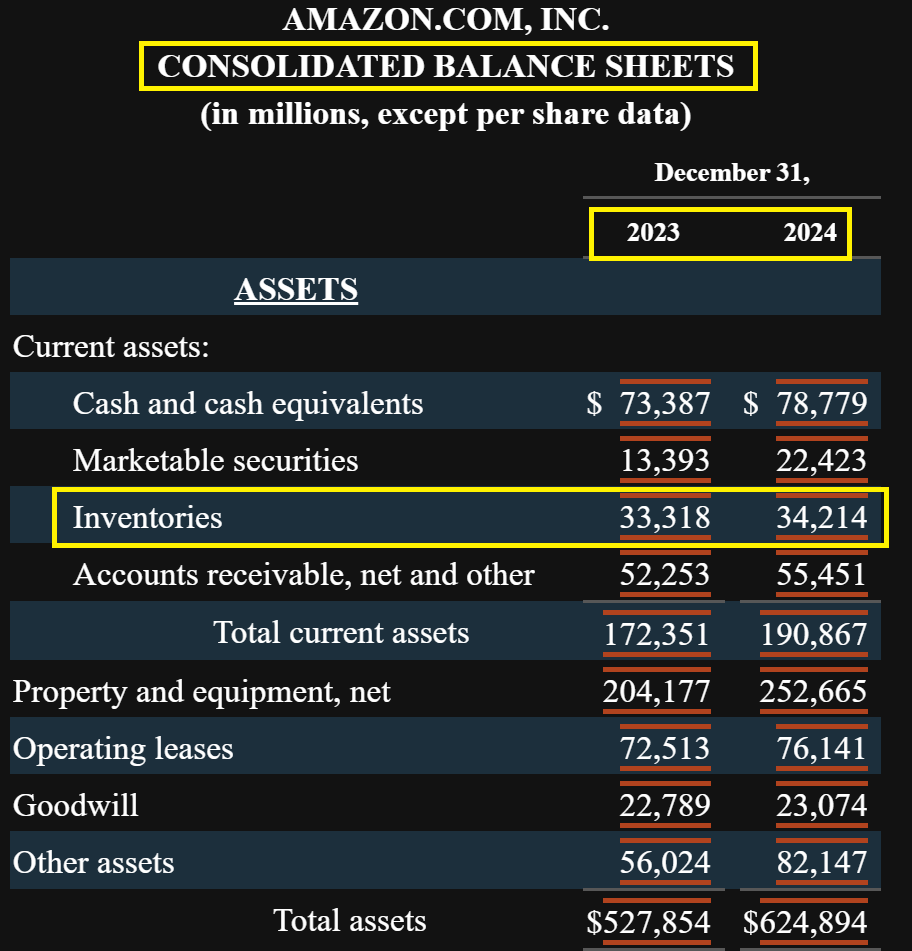
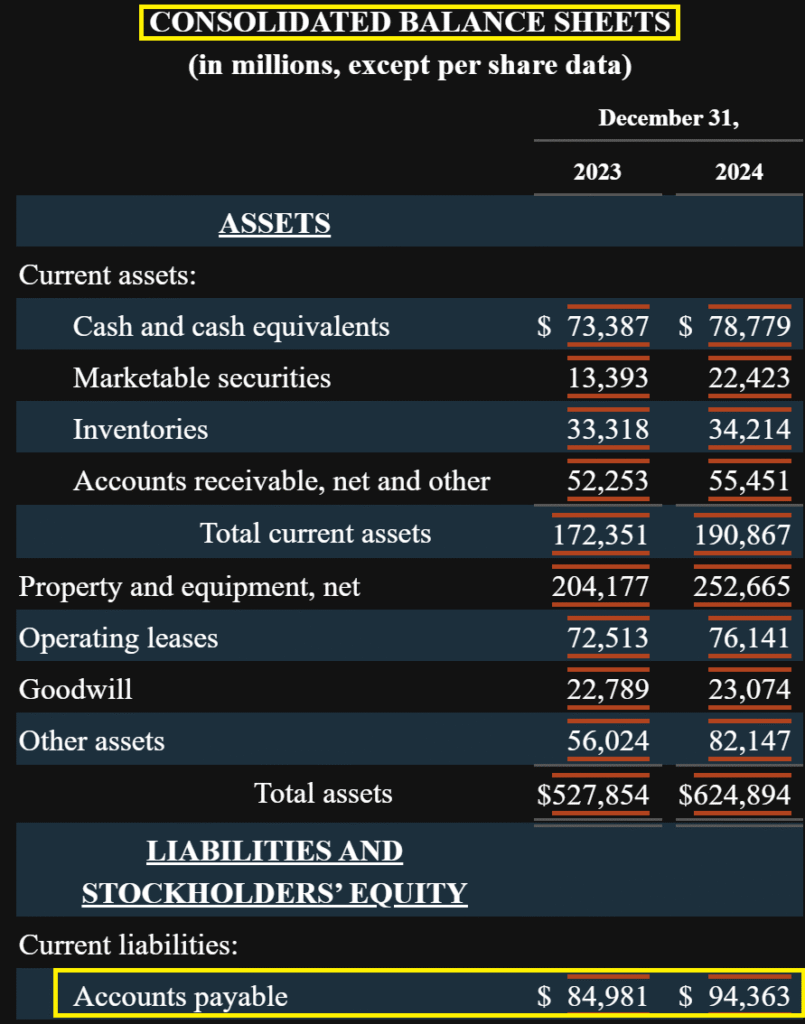
Furthermore, the average inventory is calculated by taking the average of the inventory values from the end of 2023 and 2024, which is $33,766 {=(33,318 + 34,214) / 2} million.
Now, let’s calculate the inventory turnover:
$$ \text{Inventory Turnover} = \frac{$326,288}{$33,766} = 9.66 $$
Finally, we can calculate the DIO for Amazon:
$$ \text{DIO} = \frac{365}{9.66} \approx 37.78 \text{ days} $$
2. Calculating Days Sales Outstanding (DSO)
Next, we will calculate the Days Sales Outstanding (DSO). The DSO is calculated by dividing 365 days by the company’s receivables turnover. Receivables turnover’s formula is as follows:
$$ \text{Receivables Turnover} = \frac{\text{Sales}}{\text{Average Accounts Receivable}} $$
The Total Net Sales for 2024 is $637,959 million, as shown in the “Consolidated Statements of Operations.”
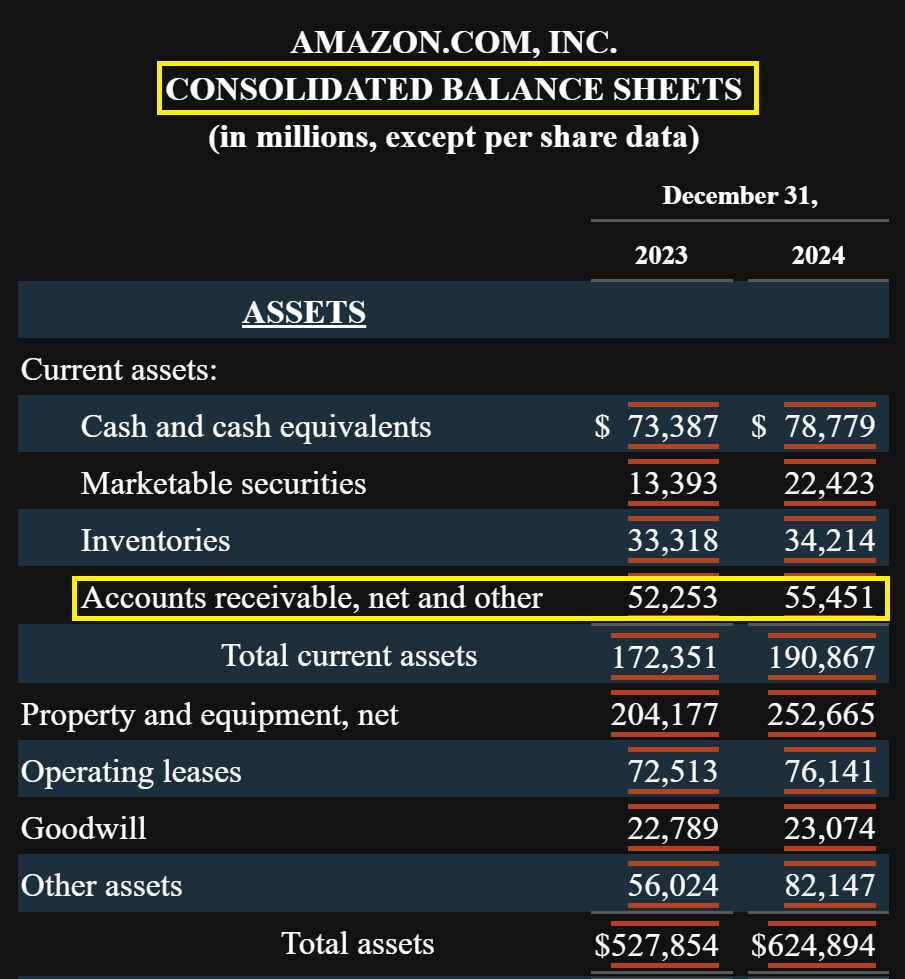
In addition, the average accounts receivable is calculated by taking the average of the accounts receivable values from the end of 2023 and 2024, which is $53,852 {=(52,253 + 55,451) / 2} million.
Now, let’s calculate the receivables turnover:
$$ \text{Receivables Turnover} = \frac{$637,959}{$53,852} \approx 11.85 $$
Finally, we can calculate the DSO for Amazon:
$$ \text{DSO} = \frac{365}{11.85} \approx 30.8 \text{ days} $$
3. Calculating Days Payable Outstanding (DPO)
Finally, we will calculate the Days Payable Outstanding (DPO). The DPO is calculated by dividing 365 days by the company’s Payables Turnover. The Payables Turnover formula is:
$$ \text{Payables Turnover} = \frac{\text{Cost of Goods Sold}}{\text{Average Accounts Payable}} $$
As we checked during calculating DIO, the Cost of Goods Sold (COGS) for 2024 is $326,288 million.
The average accounts payable is calculated by taking the average of the accounts payable values from the end of 2023 ($84,981 million) and 2024 ($94,363 million), which is $89,672 {=(84,981 + 94,363) / 2} million.
Now, let’s calculate the payables turnover:
$$ \text{Payables Turnover} = \frac{$326,288}{$89,672} \approx 3.64 $$
Finally, we can calculate the DPO for Amazon:
$$ \text{DPO} = \frac{365}{3.64} \approx 100.3 \text{ days} $$
Final Cash Conversion Cycle Calculation
With all three components calculated, we can now find the final cash conversion cycle (CCC) for Amazon:
CCC = DSO + DIO – DPO = 37.78 + 30.8 – 100.3
$$ \text{CCC} = -31.72 \text{ days} $$
Why Amazon’s Cash Conversion Cycle is so Unique
The entity we will be analyzing is Amazon.com Inc. (NASDAQ: AMZN), which is the publicly traded company listed on the NASDAQ stock exchange. Amazon is a fascinating case study for the cash conversion cycle because it is well-known for its negative CCC.
This negative CCC means that the company collects payments from its customers before it has to pay its suppliers. Consequently, this is a highly desirable financial position, as it allows a company to essentially fund its operations and growth using its vendors’ money, rather than needing to take on debt or use its own capital. Amazon achieves this through its incredibly efficient supply chain, rapid sales, and strong negotiating power with its suppliers to secure extended payment terms.
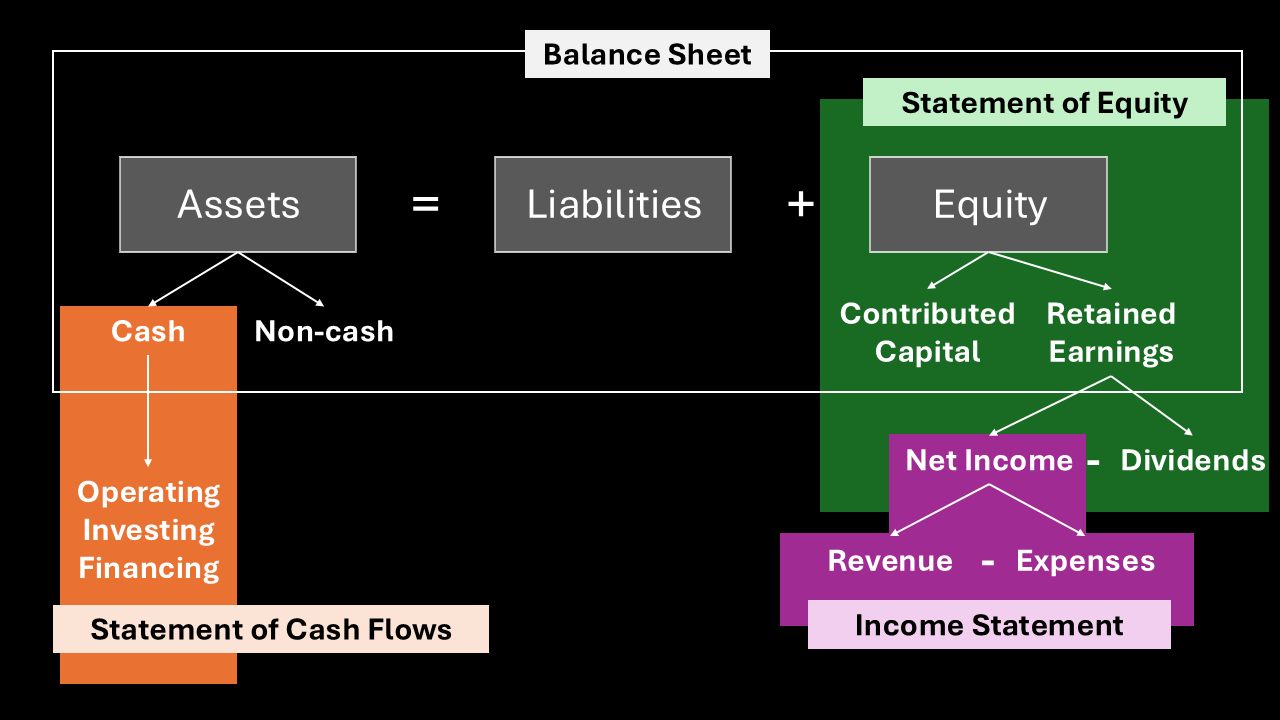
A Note on Income Statements
When looking at a company’s financial report, you might notice that the “Income Statement” is called by a different name. Companies often use different terminology, and it can be a source of confusion.
You may find a “Consolidated Statements of Operations” or “Consolidated Statements of Earnings,” which are common names for the income statement. Other terms you might encounter are “Profit and Loss Statement” or “P&L.” All of these refer to the same document that summarizes the company’s revenues and expenses to show its profitability.
You will also find a “Comprehensive Income Statement,” which is slightly different. The income statement focuses on revenue and expenses from a company’s day-to-day business operations. The comprehensive income statement includes all of that, plus any unrealized gains and losses that are not related to core operations. These items, such as foreign currency gains or losses on certain investments, can affect a company’s equity but are not yet “realized” as cash. The comprehensive statement provides a more complete picture of the total change in a company’s financial position.
How to Retrieve Financial Statements from the SEC’s EDGAR Database