![]()
Overview of the Statement of Cash Flows
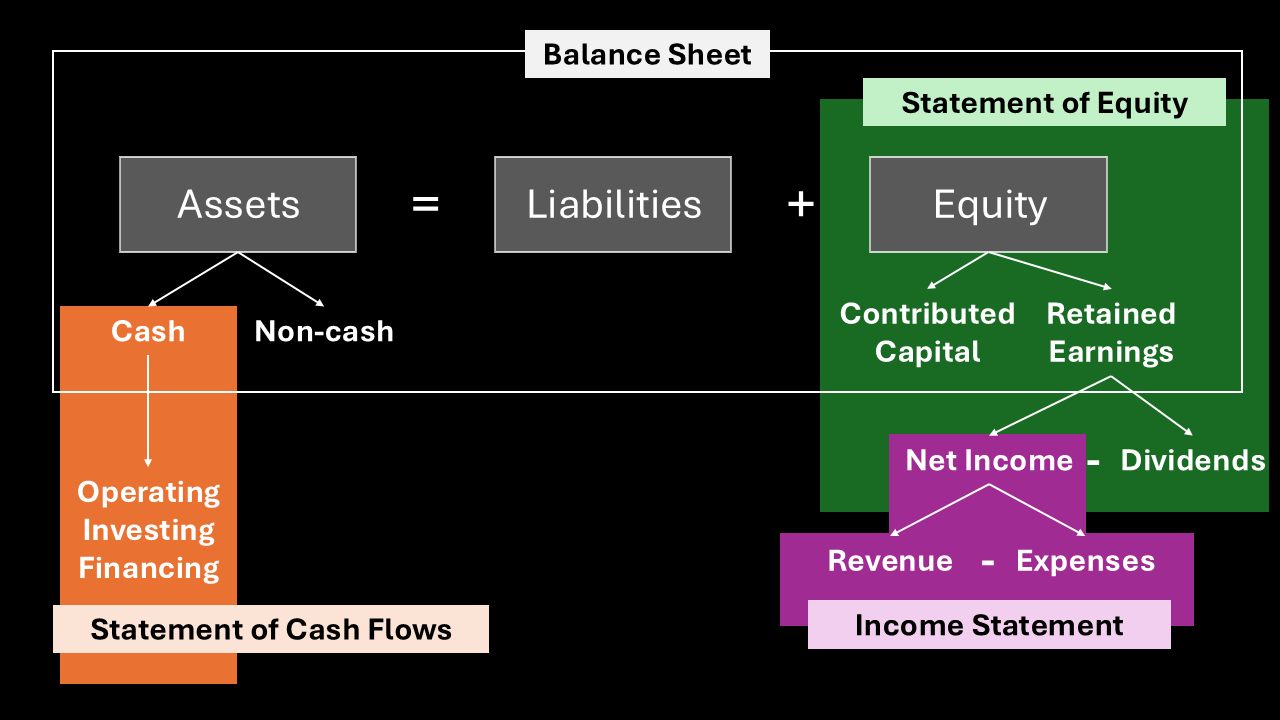
Building on our previous exploration of the Balance Sheet, this section will now focus on the Statement of Cash Flows and its connection to the diagram above. In essence, the Statement of Cash Flows explains the change in the Cash balance from one period to the next by breaking down all the cash inflows and outflows. Therefore, it provides a bridge between the Income Statement and the Balance Sheet.
The diagram shows how Cash from the balance sheet links to three main activities:
- Operating Activities: This section shows the cash generated or used by a company’s normal business operations.
- Investing Activities: This section details the cash flows from the purchase and sale of long-term assets and other investments.
- Financing Activities: This section shows the cash flows related to a company’s capital structure. This includes raising capital by issuing debt or stock (cash inflows) and paying dividends or buying back its own stock (cash outflows).
Consequently, by analyzing the Statement of Cash Flows, we can see where Microsoft is generating and using its cash. For example, a company with strong Operating cash flow is generally considered healthy, as its core business is profitable. Similarly, a company with high Investing cash outflows might be growing and expanding its business.
Calculating the Ending Cash Balance
To connect this to the numbers, we can see how the ending cash balance is derived directly from the Statement of Cash Flows. First, the net change in cash for the year is the total of the cash from operating, investing, and financing activities, adjusted for the effect of foreign exchange rates. Therefore, we can calculate this using the figures from the financial statement (in millions):


- Net cash from operations: $136,162
- Net cash used in financing: −$51,699
- Net cash used in investing: −$72,599
- Effect of foreign exchange rates: +$63
Putting it all together, the net change is: $136,162−$51,699−$72,599+$63=$11,927.
Then, the ending cash balance is simply the cash at the beginning of the period plus this net change.
Using Microsoft’s Statement of Cash Flows for the year ended June 30, 2025, we can see this calculation in action.
- Cash and cash equivalents, beginning of period: $18,315
- Net change in cash and cash equivalents: $11,927
- Cash and cash equivalents, end of period: $30,242
So, the final calculation is: $18,315+$11,927=$30,242. This is the exact number we confirmed as the Cash and cash equivalents on the Balance Sheet in the previous post.
