![]()
Process Analysis: Cranberry Case 2
Demand Rates
Now, let’s analyze the demand during the peak season. The expected average delivery this year is approximately the same as last year’s: 16,379.8 bbls/day. Of this, 70% is expected to be wet cranberries.
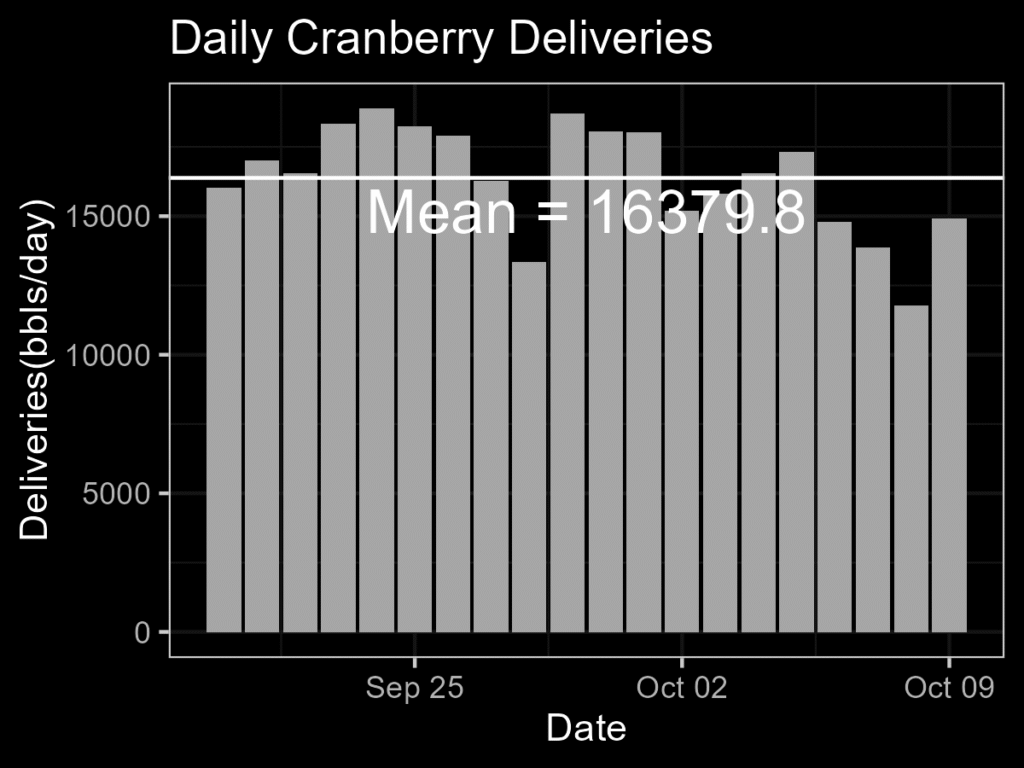
To determine if the current capacity is sufficient, we need to see if there will be a problem. For simplicity, let’s assume the daily delivery of 16,379.8 bbls is distributed equally over the 12 hours of truck arrivals.
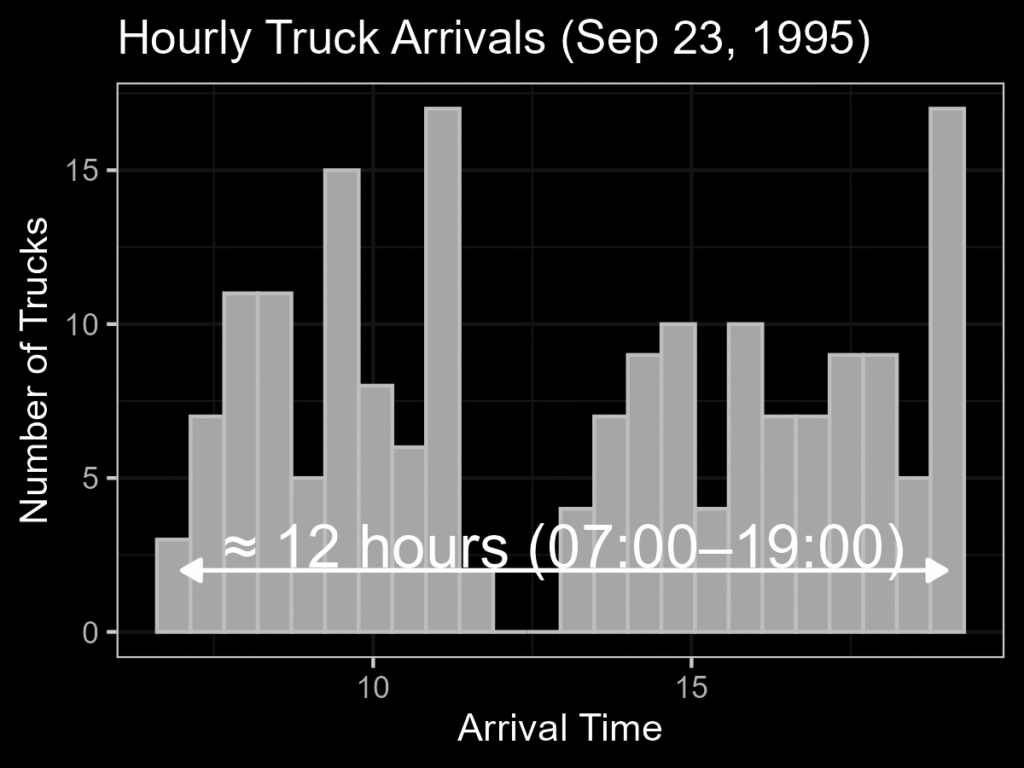
- The total delivery rate is approximately 1,364.98 bbls per hour (16,379.8/12).
- The delivery rate for dry cranberries is 409.49 bbls/hr (30% of 1,364.98).
- The delivery rate for wet cranberries is 955.49 bbls/hr (70% of 1,364.98).
The Initial Bottleneck
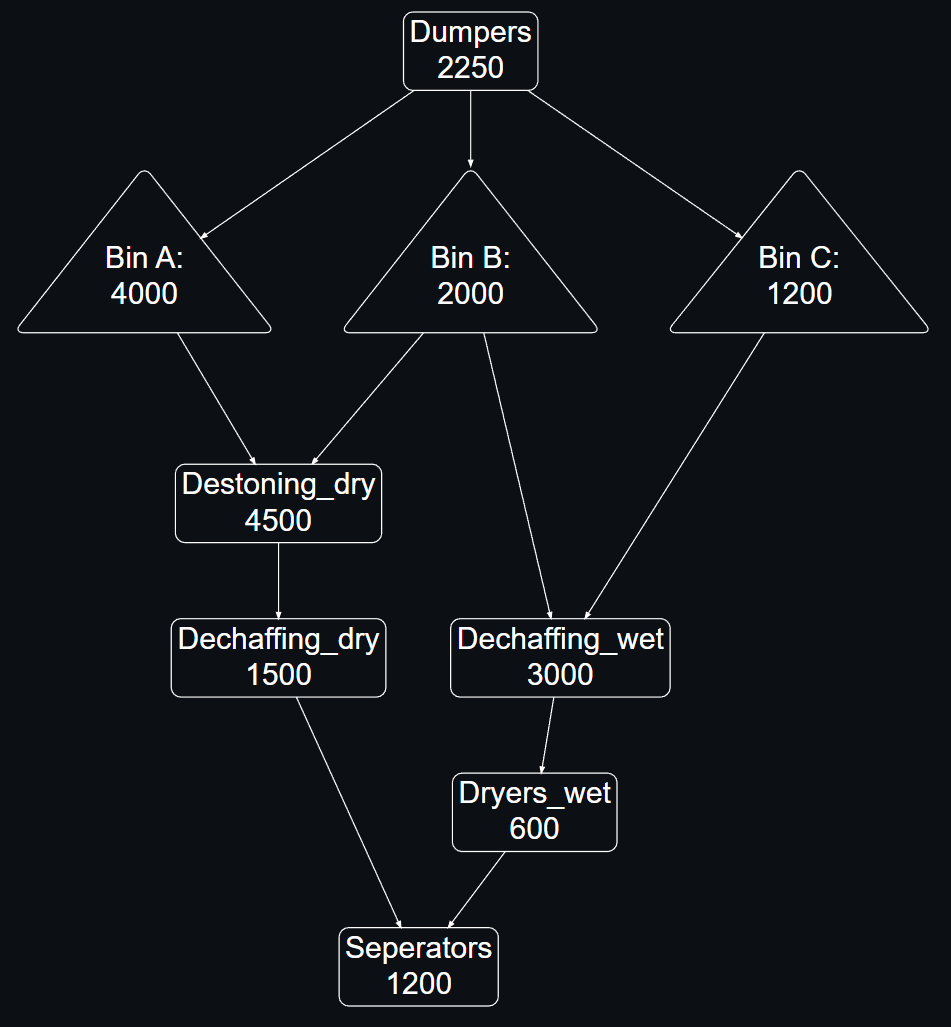
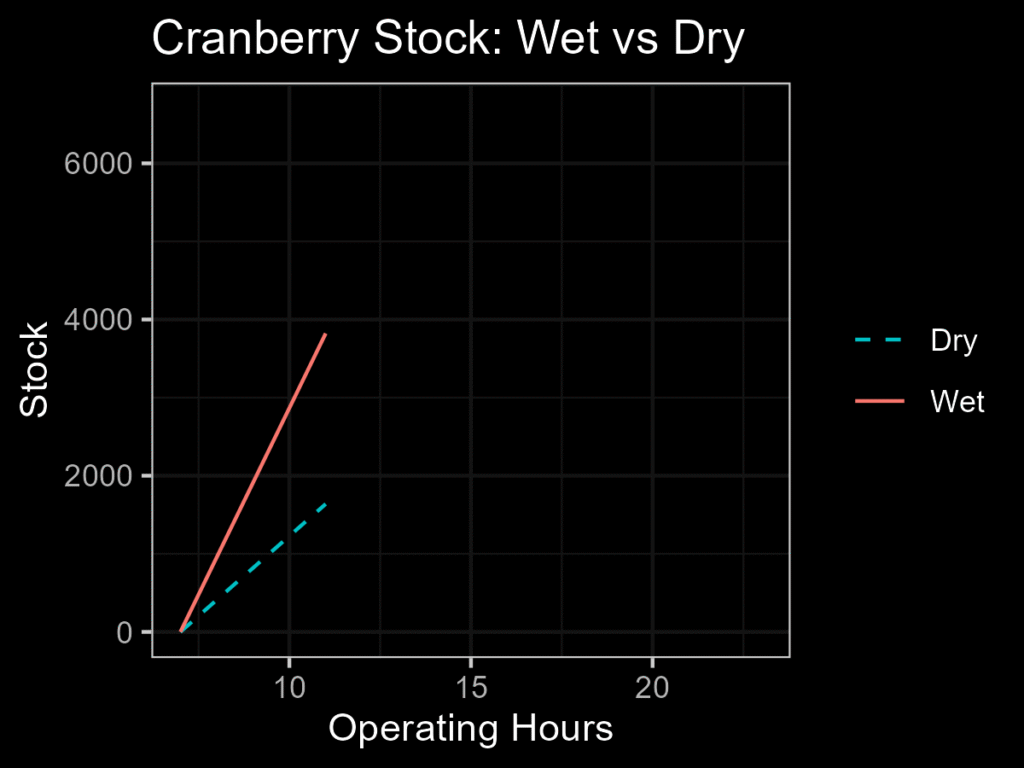
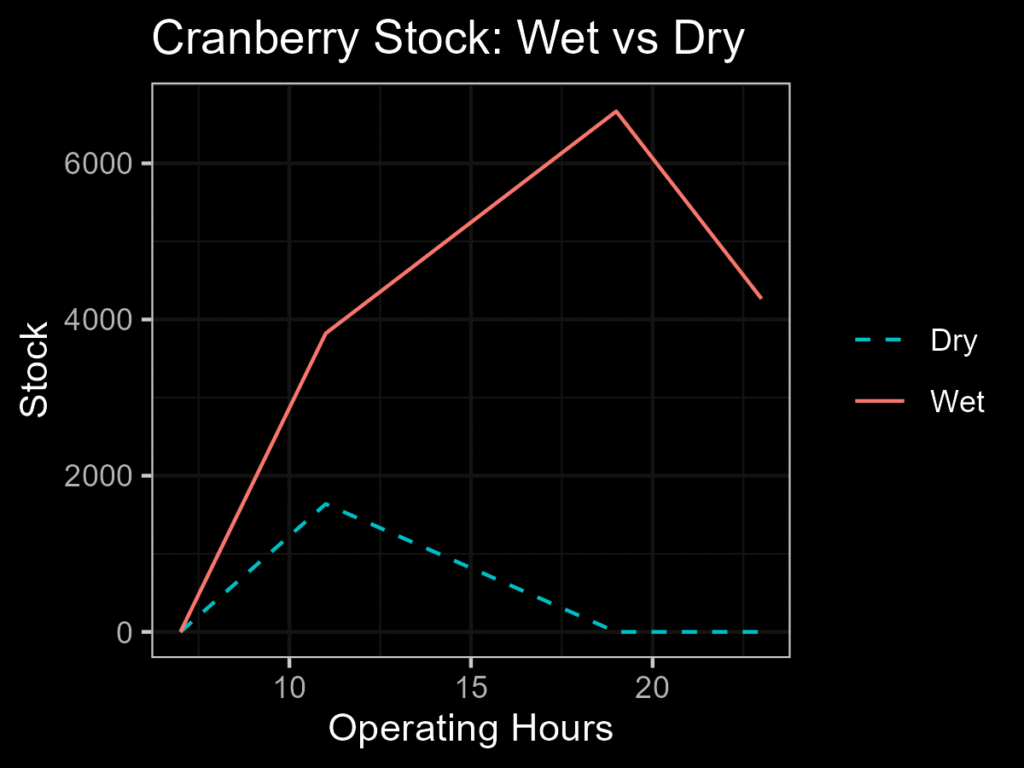
Now let’s consider what happens between 7:00 am and 11:00 am, when workers are only at the dumpers and bins. During this period, cranberries are unloaded from trucks and placed into the temporary storage bins. The dumpers have a capacity of 2,250 bbls/hr, which is well above the total delivery rate of 1,364.98 bbls/hr. This means that truck drivers should not experience significant waiting times to unload. But the stock of berries in the bins will increase. The dry cranberry stock will increase by 1,637.98 bbls (409.49 bbls/hr * 4 hours), and the wet cranberry stock will increase by 3,821.95 bbls (955.49 bbls/hr * 4 hours).
Dry Cranberry Processing
Now let’s analyze the processing flow for dry cranberries from 11:00 am to 7:00 pm. During this 8-hour period, cranberries are both arriving from trucks (at a rate of 409.49 bbls/hr) and being processed by the machinery. The total amount of dry cranberries to be processed during this period is the initial stock accumulated in the bins (1,637.96 bbls) plus the fresh deliveries.
The total dry cranberry inflow for the 8 hours is 409.49 bbls/hr×8 hours=3,275.92 bbls.
This makes the total supply of dry cranberries available for processing 1,637.96+3,275.92=4,913.88 bbls.
The dry cranberry processing line is limited by the dechaffing capacity of 1,500 bbls/hr. Over the 8-hour shift, the total capacity is 1,500 bbls/hr×8 hours=12,000 bbls.
Since the total supply of dry cranberries (4,913.88 bbls) is far below the processing capacity (12,000 bbls), the factory can handle the dry cranberries seamlessly without any backlog or idling.
For example, if dried cranberries can be processed at 614.2425 bbls/hr from 11:00 AM to 7:00 PM, then the dry stock at 7:00 PM would be 0, calculated as: 1637.96−(614.2425−409.49)×8=0
Wet Cranberry Bottleneck
However, the situation for wet cranberries is quite different. The processing capacity for wet cranberries is limited by the dryer, which has a capacity of just 600 bbls/hr. Since wet cranberries are arriving at a rate of 955.49 bbls/hr, the stock will continuously increase during the 8-hour shift from 11:00 am to 7:00 pm. The inventory will grow at a rate of 355.49 bbls/hr (955.49 bbls/hr arrival rate minus 600 bbls/hr processing rate). As a result, by 7:00 pm, the initial stock of 3,821.96 bbls will have grown to a total of 6,665.88 bbls (3,821.96+355.49×8). This creates a significant bottleneck and a major operational problem for the plant.
To deplete this stock, the factory would need to run for an additional 11.11 hours (6,665.88/600) from 7:00 pm. However, the factory shuts down at 11:00 pm. The cranberries that have not been processed by that time would need to be discarded. This scenario clearly demonstrates that the current status quo is not sustainable and an intervention is required.
Reference:
National Cranberry Cooperative Case Study by J. Tucker, 1996, Harvard Business School.