![]()
The Cash Conversion Cycle: The Key to a Healthier Business

For any business, big or small, cash is king. It’s the lifeblood that keeps operations running, and managing it effectively is crucial for long-term survival and growth. For external stakeholders like investors and analysts, measuring a company’s exact cash flow can be difficult. This is where the Cash Conversion Cycle (CCC) comes in as a powerful and essential metric for evaluating a company’s financial health.
What is the Cash Conversion Cycle?
The Cash Conversion Cycle measures the time, in days, it takes for a company to convert investments in inventory into cash from sales. Think of it as the journey of a dollar: from the moment you spend it to buy inventory to the moment you get it back from your customer.
A shorter CCC is a sign of operational efficiency. It means you’re converting cash quickly, which frees up capital to reinvest in the business, pay down debt, or fund new initiatives. A longer CCC, on the other hand, can indicate that cash is tied up in your operations, potentially leading to liquidity issues.
Why a Shorter Cycle Matters
A short or even a negative CCC is highly desirable. A negative CCC, as seen in companies like Amazon, means you’re collecting cash from customers before you’ve paid your suppliers. This allows the business to use its suppliers’ money to fund its own operations, which is a powerful advantage.
A short CCC signals that a company has:
- Stronger Liquidity: More cash on hand to meet short-term obligations.
- Efficient Operations: A well-oiled machine from purchasing to sales.
- Greater Financial Flexibility: Capital available for strategic investments and growth.
How get Conversion Cycle Formula
Of course, we can’t consider all the detailed cash flow, we focus fundamental and available information to calculate Cash Conversion Cycle. Think easily. If you run a business, a typical process is like this: You pay money to buy something to make a product, then you sell your product, and finally, you get the money from your customers.
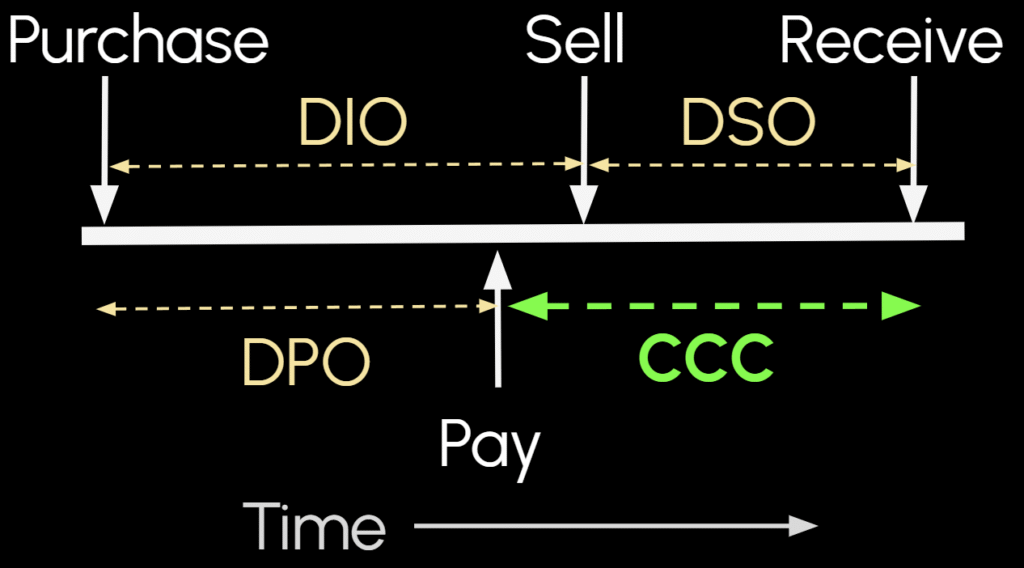
In this journey, there are three key periods: 1. from the purchase of inventory to the sale (DIO), 2. from the sale to the collection of cash (DSO), and 3. from your initial purchase to your payment to suppliers (DPO). The time your money is tied up in this cycle is represented by the formula CCC=DIO+DSO−DPO as shown in the diagram.
So yes, the CCC is calculated by combining three key metrics:
$$\text{CCC} = \text{DIO} + \text{DSO} – \text{DPO}$$
Let’s break down each component:
- Days Inventory Outstanding (DIO): This measures how long it takes, on average, to sell off your inventory. A lower DIO means you are moving products quickly.
- Days Sales Outstanding (DSO): This shows the average number of days it takes to collect payments from your customers after a sale. A lower DSO indicates efficient accounts receivable processes.
- Days Payable Outstanding (DPO): This represents the average number of days you take to pay your suppliers. A higher DPO is often seen as favorable because it allows you to hold onto your cash for a longer period.
How to Calculate the Cash Conversion Cycle Formula
Calculating Days Inventory Outstanding (DIO)
So how do you calculate DIO, DSO, and DPO? Let’s start with DIO with a simple example. Assume you sell 100 products in one year. Your average number of products in stock is 5. This means your inventory “turns over” 20 times in a year (100 products sold / 5 products on hand = 20). In reality, you would use the dollar value of your total cost of goods sold and the dollar value of your average inventory, as it’s nearly impossible to count each inventory item individually. This is called Inventory Turnover. We calculate this as:
$$\text{Inventory Turnover} = \frac{\text{Cost of Goods Sold}}{\text{Average Inventory}}$$
If your inventory turns over 20 times in one year, each item on average stays in stock for 18.25 days (365/20=18.25). This is your DIO.
$$\text{DIO} = \frac{365}{\text{Inventory Turnover}}$$
$$\text{DIO} = \frac{365}{20} = 18.25 \text{ days}$$
This means that on average, a product stays in your inventory for about 18 days before it’s sold.
Calculating Days Sales Outstanding (DSO)
Now let’s look at DSO with an example. Assume your business had $365,000 in sales for the year and your average accounts receivable is $30,000. Accounts Receivable is the money your customers owe you. To find the DSO, you need to calculate the Receivables Turnover, which shows how many times your company collects its average accounts receivable balance in a year:
$$\text{Receivables Turnover} = \frac{\text{Sales}}{\text{Average Accounts Receivable}}$$
$$\text{Receivables Turnover} = \frac{365,000}{30,000} \approx 12.17$$
This means you collect your money, on average, just over 12 times a year. To find the DSO, you can divide the number of days in a year by the Receivables Turnover:
$$\text{DSO} = \frac{365}{\text{Receivables Turnover}}$$
$$\text{DSO} = \frac{365}{12.17} \approx 30 \text{ days}$$
This means it takes you about 30 days to collect the cash from a sale.
Calculating Days Payable Outstanding (DPO)
Finally, let’s look at DPO. This metric helps you understand how long you take to pay your own bills. Imagine your business had $200,000 in costs of goods sold and your average accounts payable is $15,000. Accounts Payable is the money you owe to your suppliers.
To find the DPO, you’ll first calculate the Payables Turnover, which shows how many times a year you pay your suppliers, on average. The formula is:
$$\text{Payables Turnover} = \frac{\text{Cost of Goods Sold}}{\text{Average Accounts Payable}}$$
$$\text{Payables Turnover} = \frac{200,000}{15,000} \approx 13.33$$
This means you’re paying off your accounts payable about 13 times a year. Now, you can use this number to find your DPO:
$$\text{DPO} = \frac{365}{\text{Payables Turnover}}$$
$$\text{DPO} = \frac{365}{13.33} \approx 27.38 \text{ days}$$
This means you hold on to your cash for about 27 days, on average, before paying your suppliers. A higher DPO is good for your cash flow, as long as it doesn’t damage your relationships with suppliers.
A Note on Public Data and Limitations
When analyzing publicly traded companies, it is often difficult for external parties to find the exact figures for Net Credit Sales or Credit Purchases in their financial statements. The most accurate way to calculate DSO and DPO would be to use these specific figures, as the CCC is fundamentally about the cash cycle of credit transactions.
However, since this information is not typically disclosed, analysts must use substitutes: Total Sales for DSO and Cost of Goods Sold for DPO. This can lead to a slight inaccuracy: the calculated Receivables Turnover and Payables Turnover may be slightly inflated, which in turn can make the DSO and DPO appear shorter than they are in reality.
Despite this small margin of error, using publicly available data in this way is a necessary and widely accepted practice, and the CCC remains one of the best tools for outsiders to estimate a company’s cash flow health and operational efficiency.